Popping balloons (2)
Expected value of a single balloon
Let us assume, as before, that the balloon pops at a certain level \(M\), and we believe \(M \sim \text{uniform}(1, 21)\). \(M = 1\) means the balloon will pop immediately after we pump it once.
I figured out in the last post that the optimal strategy in this case is to push 10 or 11 times, then stop. But what is then the expected value of this game? There are two options, either we reach 10 pushes without popping the balloon, or it pops before we get there. Let's call our cashout \(B\), and the expected value is
\begin{align} \mathbb{E}\left(B\right) &= \mathbb{P}\left(\text{reach 10 pushes}\right) \cdot 10 \\ &= \mathbb{P}(M > 10) \cdot 10 = 5 \end{align}This is a simple formula, the expected value is the probability of reaching the goal times the goal set. Using this, we can easily evaluate other strategies. For example, what if our strategy is to play 11 times?
11 * (9 / 20)
4.95
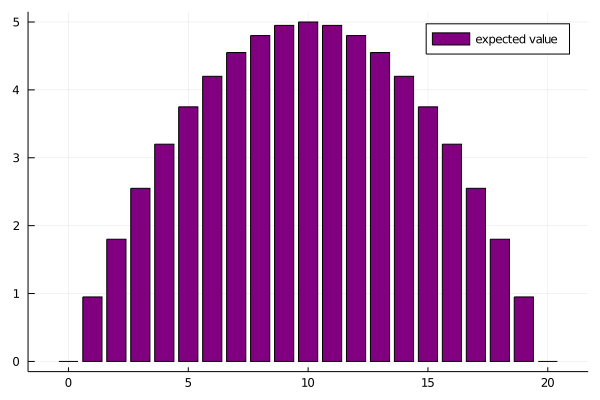
Plotting the expected value for all strategies, it follows a parabole, topping out at 10 as calculated before.
using Plots

bar(x -> (x * (20 - x) / 20), 0:20, labels="expected value", color="purple")
A different distribution for \(M\)
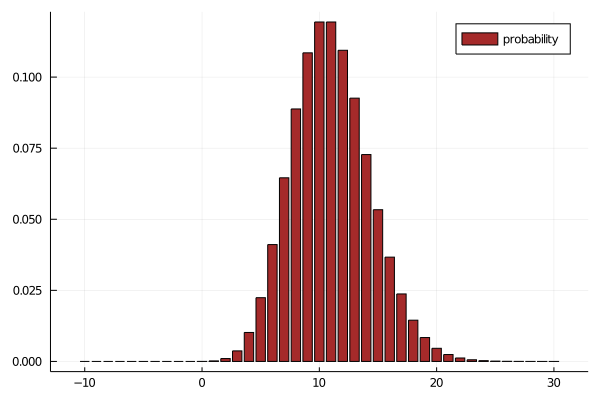
Now what if I believe \(M\) to follow a Poisson distribution, and let's take 11 as the parameter as an example. First a plot of the distribution of \(M\).
using Distributions

belief = Poisson(11)

bar(x -> pdf(belief, x), -10:30, labels="probability", color="brown")
And these are the expected values of playing on until a certain payoff
belief = Poisson(11)

expected = x -> (1 - cdf(belief, x)) * x

bar(expected, 0:20, labels="expected value", color="yellow")
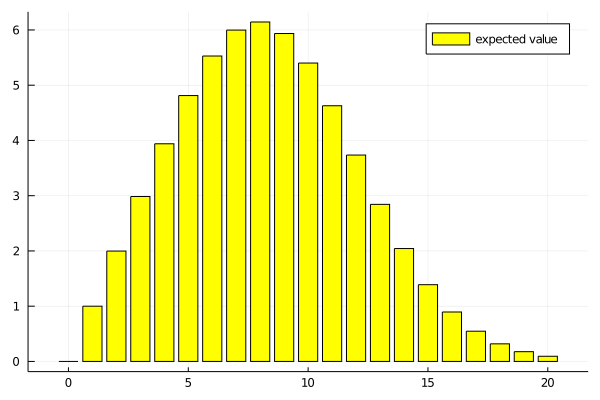
The optimal strategy is to play 8 rounds. The interesting thing is that the two underlying distributions I analyzed have the same average, but with a Poisson distribution it is optimal to stop before reaching the average round at which the balloon pops.
mean(Uniform(1, 21)), mean(Poisson(11))
| 11.0 |
| 11.0 |
Summary
In this post I used a much more straightforward formula to find the optimal strategy, and was able to calculate expected payoffs for different strategies for two different distributions. How the shape of the distribution influences the optimal strategy is interesting, can this be generalized to other distributions? Thanks for reading this post, if you want to reach out, post an issue to the Github repository of this website or contact me on Twitter!